

Overview
Archaeological Land Use is an approach to the spatiotemporal analysis of an excavation that seeks to identify and interpret different activities, functions, or purposes associated with specific areas within an archaeological site (see Steane 1993). It should be noted that the classic formal DUA-MoLA style ‘Land Use Diagrams’ advocated by the likes of Westman and Shepherd (1992), Steane (1993) or Roskams (2001) and Hammer, see below (2002) are not necessarily common practice, especially since the development in the later 1990s, and now relatively widespread use, of Geographic Information Systems (GIS) for archaeological spatial analysis. But most large sites will include some form of synthesis (probably narrative) which takes into account some discussion of land use.
Land use analysis then, is a ‘spatio-chronological’ mode of analytical grouping that enables the reconstruction of past landscapes and the identification of patterns, transitions, and relationships between different forms of land use across a site. In this sense it is different from ‘lower order’ primary subgrouping and grouping and is designed to associate these groups into area or site wide activities (or inactivity). In this sense it helps archaeologists understand the dynamic nature of human occupation and how people interacted with their environment in the past.
Significant features like a cesspit, well or oven will have been given group numbers. At this stage in the post-ex process, these groups will be allocated to different land uses (e.g. ‘Oven Group 9’ will be put into land use ‘Building 1’). A single land use entity (e.g. building, road, open area) can exist across several phases of use (e.g. spanning medieval to 16th century)'. Examples demonstrating this approach can be found in the published Middle Saxon London land use diagram (CROSSREF to add: Fenchurch St Illustration below). It is important to note that further insights and discussion on this matter can be provided by experts in the field.
As such, the process of defining ‘land use’ and its resulting outputs (specifically the land use sequence diagram and land use plans) are not applied to all sites, being most often deployed on complex urban stratigraphic sequences. Westman and Shepherd (1992, 441-2) make an explicit connection between defining land use and the creation of a “narrative synthesis” of the site through time. They note that the Land Use Diagram “can show the passage of time realistically, if necessary, but can show spatial relationships only schematically” and that ‘plans show spatial relationships more realistically” even if they only resemble “slices cut horizontally across the Land Use Diagram” (ibid.). This suggests that the Land Use Diagram should be viewed in context with other related elements, showing how time-related groups are arranged by space.
How land uses are defined may be more or less formalised depending on organisational or project practice. Land use documentation, then (especially any written text), can serve as the foundation for a chronological narrative and may facilitate sharing of knowledge about a complex site with specialists and project collaborators. While there may be some overlap with the more fine-grained stratigraphic narrative, this text has often been considered (particularly in the DUA/MoLA school) as being the essential building blocks for creating a comprehensive narrative or archive report.
Land use diagrams, such as advocated by Hammer, involve using and synthesising the stratigraphic sequence (as separately visualized in the Harris Matrix) to understand how humans utilised and modified the land in different ways over time, providing insights into past societal practices and spatial organisation.
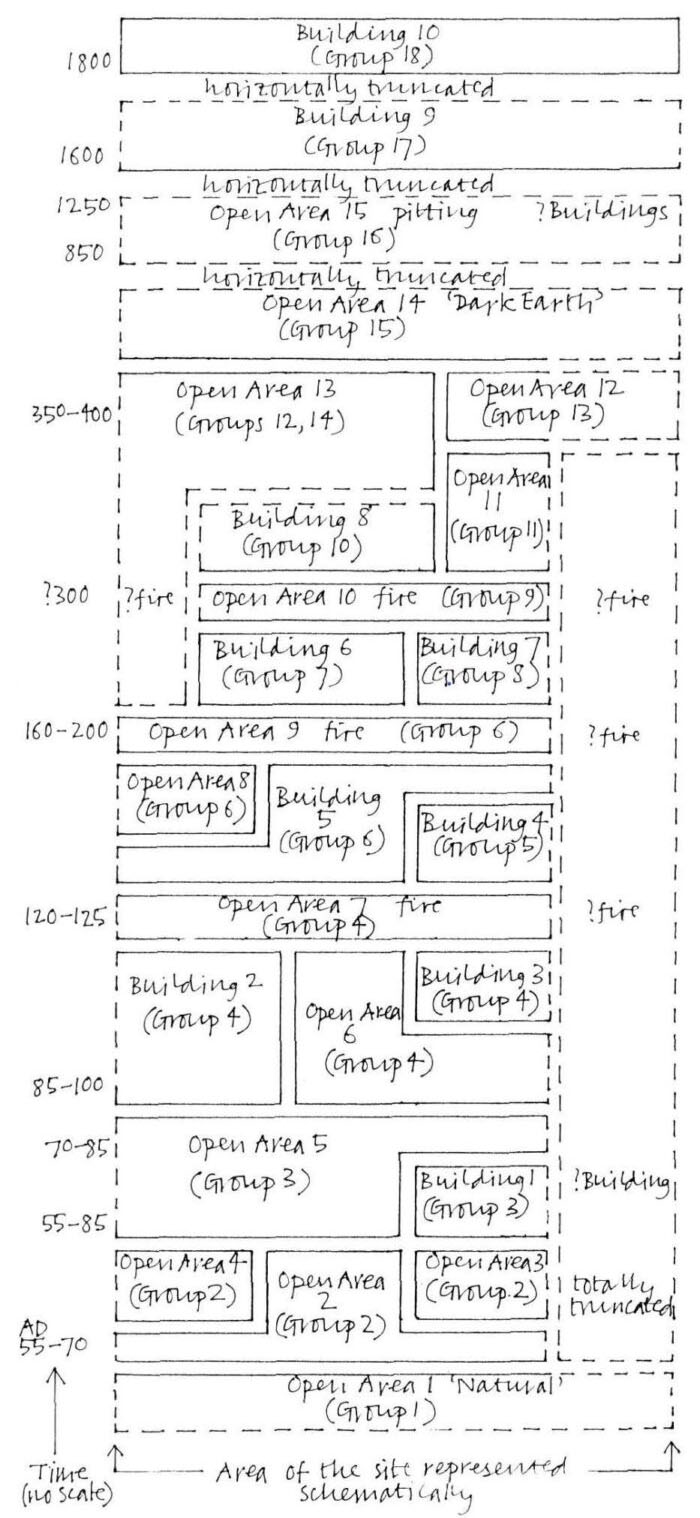
“The best way to show the development of buildings, roads and yards is by a diagram, where the three-dimensional phases of sites are drawn two-dimensionally as framed blocks of land use. The purpose of such a diagram is to show the life spans for different kinds of land use: such as for instance to the east there were two successive alterations within a building, while to the west, one open area was in use continuously and unaltered. Land use diagrams can be drawn at any level of interpretation, for groups as well as for phases”
Hammer (2002, Section 3.6)
The utility of archaeological land use diagrams increases with the complexity of stratigraphic or spatial data. For instance, when dealing with a multi-period site where numerous phases of human activity have overlapped and affected the landscape over time, creating a visual representation as an overview of changes in land use on a site over time can be beneficial, particularly for publication purposes. A land use diagram can help simplify and visually present this layered history, making it easier to understand the sequence of events and their spatial relationship across the whole site.
Similarly, when the spatial complexity of the site increases, as in the case of extensive urban excavations with multiple trenches, structures, and artefact concentrations, land use diagrams can help in visualising the distribution of findings across the site. This is especially true if these findings have varying relationships to each other in time and space. By providing a simplified bird's-eye view, these diagrams can help archaeologists understand the broader pattern of the site's use.
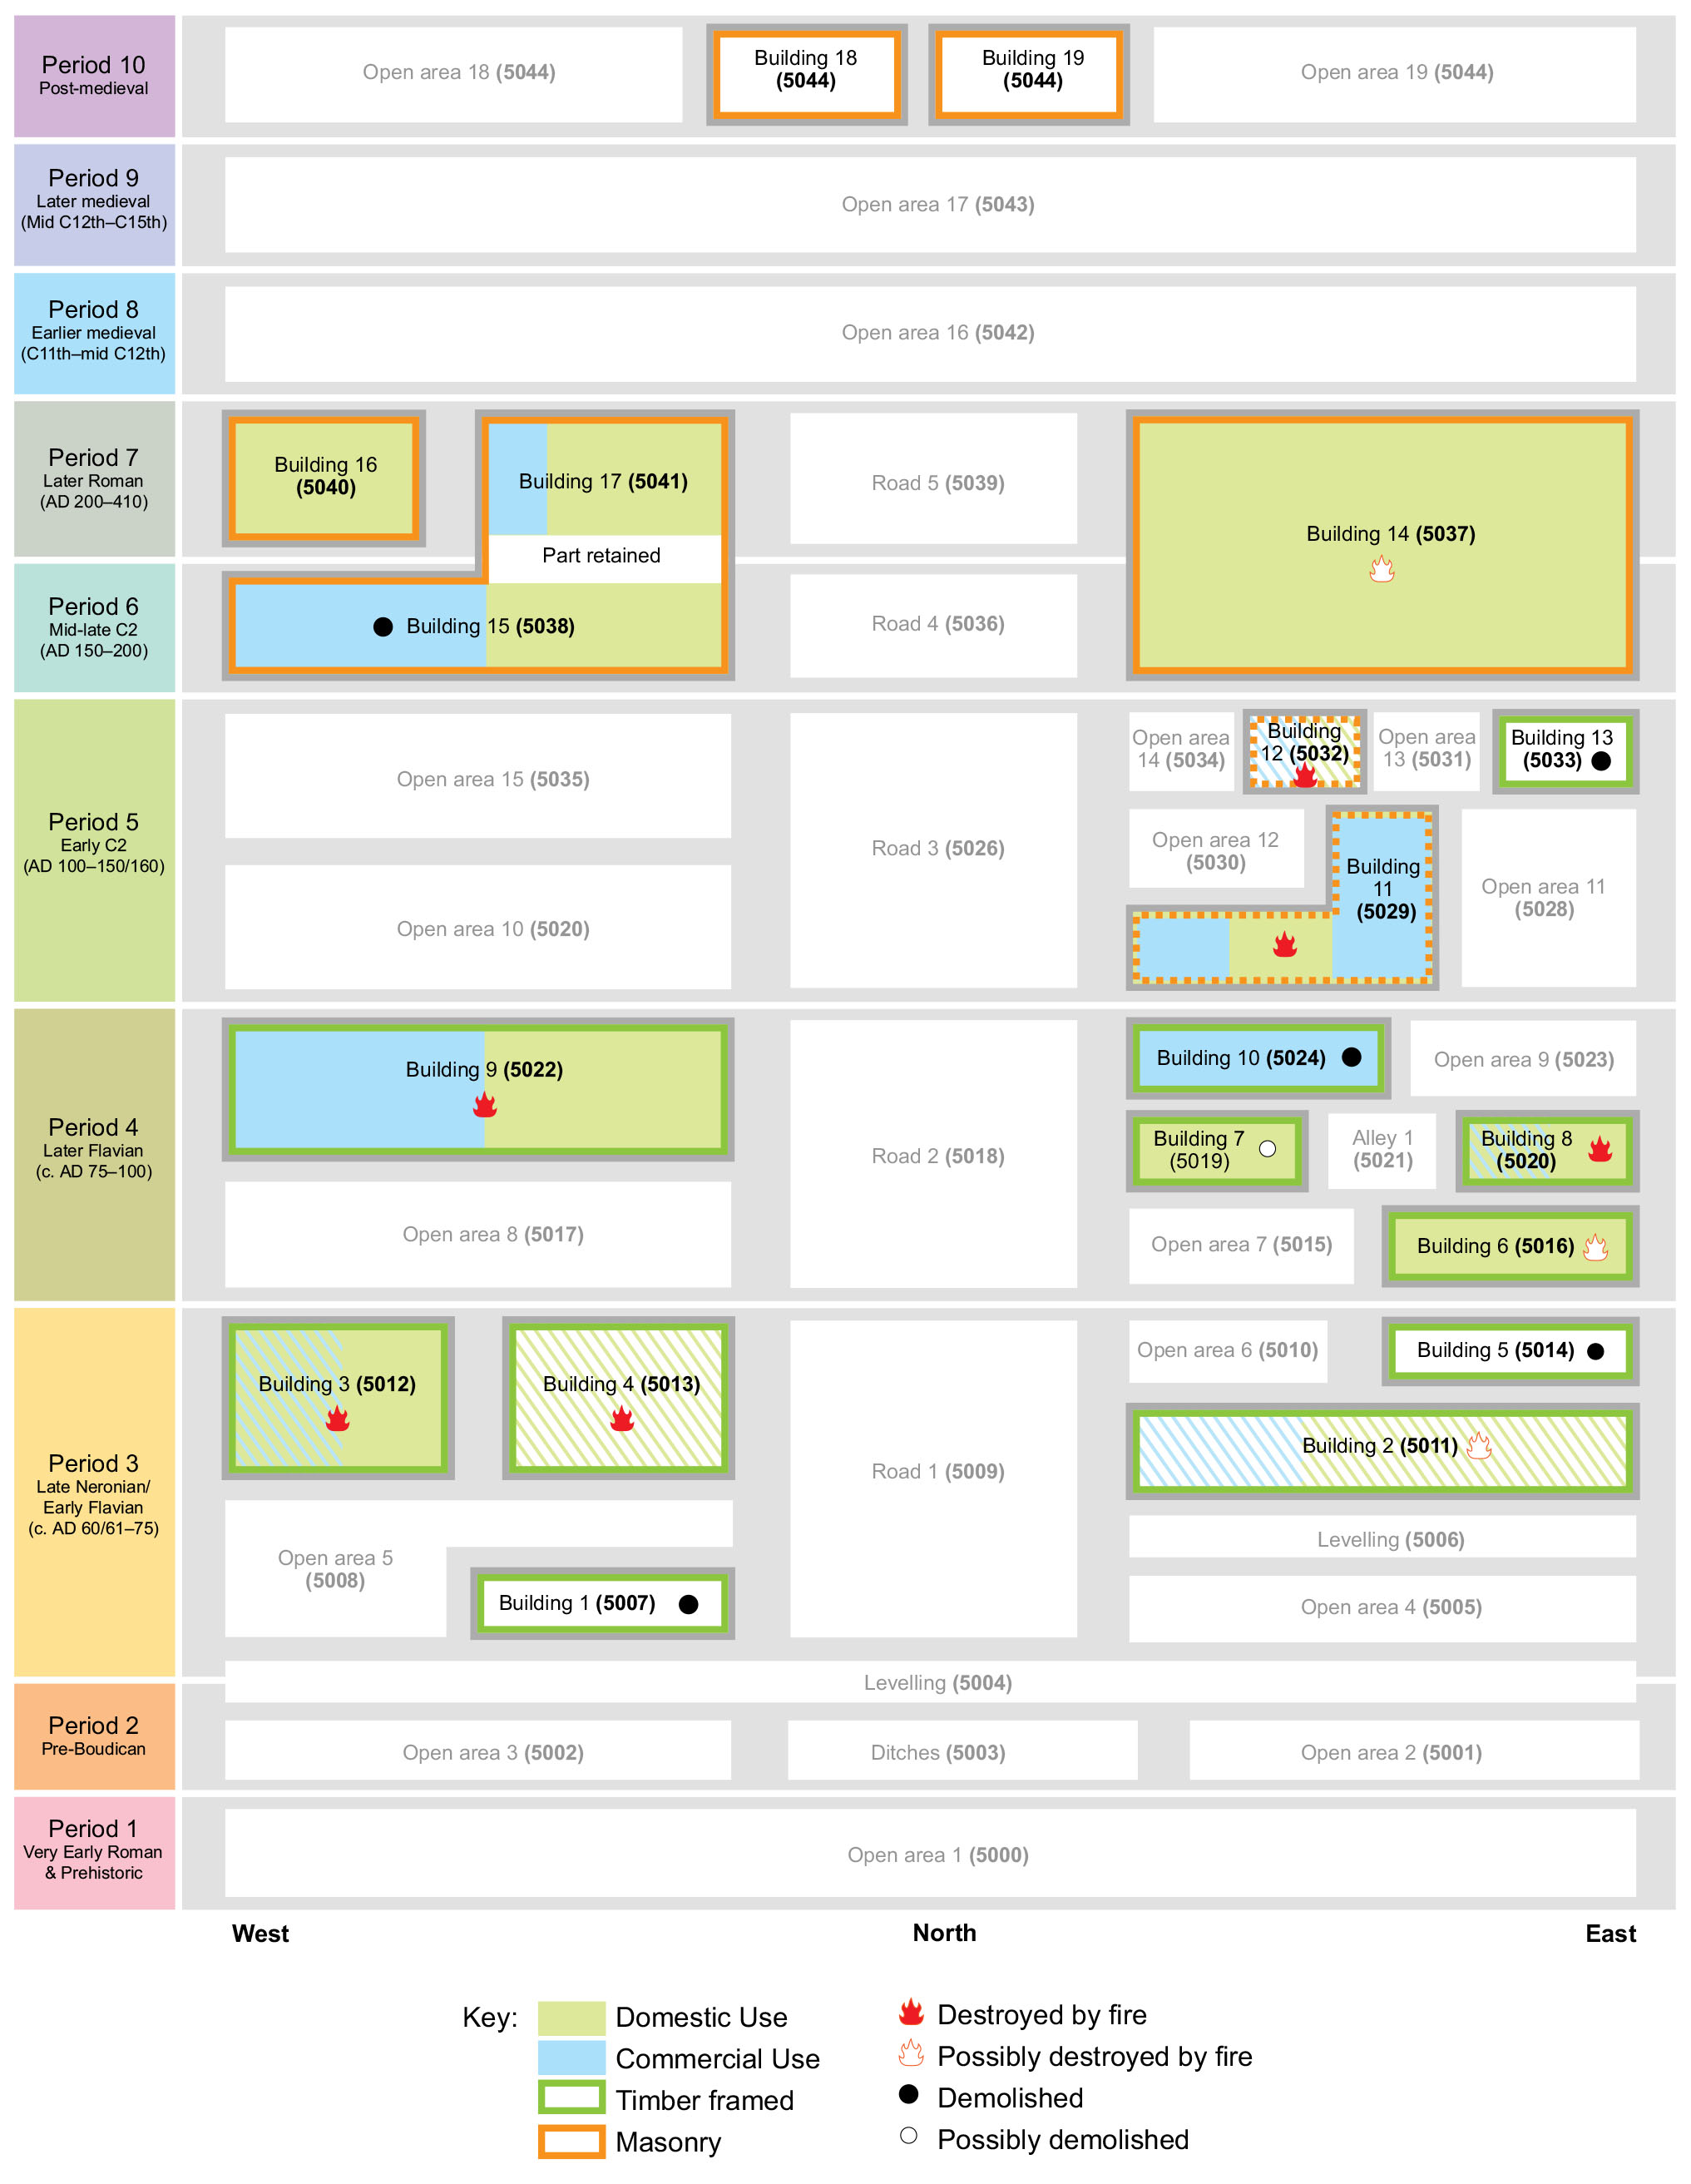
In an urban scenario, the layout of trenches would greatly impact the utility of a land use diagram. For example, if trenches are aligned along existing or past street grids, or are focused around specific structures, a land use diagram can help visualise the relationship between the archaeological findings and the urban topography. It can highlight zones of different activities (residential, industrial, etc.) and show how these zones relate to each other and to the site’s overall layout and the uses of its various spaces over time.
Digital approaches to land use and the impact of GIS
More recently, digitalisation of onsite and offsite operations including the uptake of GIS to manage spatial data from excavations have greatly transformed post-excavation analysis in archaeology, although they may not have completely eliminated the value of archaeological land use diagrams for a site with very complex or segregated stratigraphy. Instead, GIS has provided a more sophisticated and dynamic tool for creating and interpreting the information contained in such diagrams.
GIS enables archaeologists to integrate stratigraphic, spatial and chronological data, to visualise successive phases of activity and to examine changing relationships between buildings, routes and open areas. In this sense some of the work formerly undertaken through land use diagrams may be carried out within GIS-based plans and spatial analysis. As such, it allows for the spatial analysis and visual representation of archaeological data in a more detailed and interactive manner. It enables the overlaying of various types of information such as topography, vegetation, hydrology, and archaeological findings on the same plan. This kind of layered analysis provides a more comprehensive understanding of past land use patterns.
The flexibility and adaptability of GIS make it an effective tool for modelling different scenarios, thus aiding in the interpretation of archaeological data in ways that static diagrams can't match. For instance, GIS can help identify areas of potential archaeological significance that need further investigation or preservation, which can be crucial in planning and development contexts.
However, traditional archaeological land use diagrams may still hold value as they can provide a tangible, simplified overview of findings, which can be helpful for publication, presentations, educational purposes, or as a part of the initial analysis stages. Moreover, not all archaeological projects may have access to the resources or expertise needed to employ GIS.