Thank you to everyone who responded to the member survey. This survey is released every other year and the results help CIfA to steer our actions over future years. A series of bulletins will be sent out over the next few months with the breakdown of the survey's results.
The 2020 members survey had 665 respondents, 17.58% of the total membership (3783). This is a slightly lower engagement to the 2018 survey, 19.79% of the membership responded (735 respondents). In 2016 15.85% of the membership responded (526).
Demographics
The information about demographics help to fill in the gaps which we don't ask for when you become a member of CIfA and helps us understand our member demographics and compare these with other sector reports, such as Profiling the Profession. This dataset can help us highlight areas where we can improve in line with our strategic plan priorities.
We collected responses about members' gender, age (by bracket), ethnicity and disabilities. Plus information about members' workplaces and contracts.
Gender
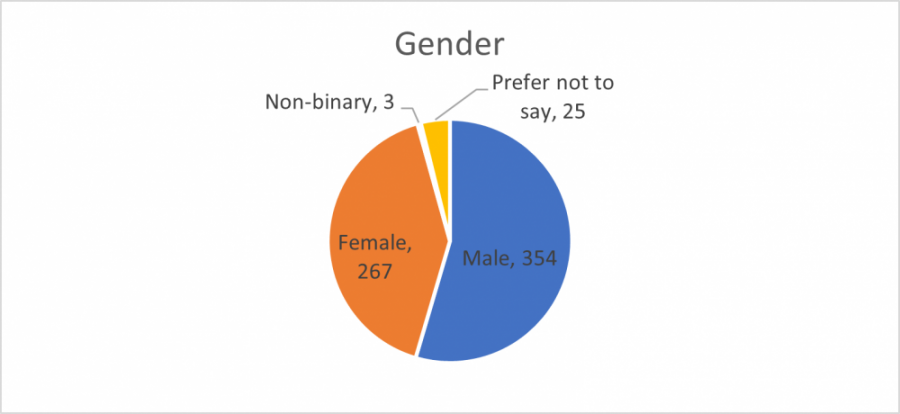
Just over 50% of respondents identified as male and 41% as female. A further 4% preferred not to say. Three respondents identified as non-binary. Six respondents skipped this question.
Most of the respondents identified as the same gender they were assigned with at birth (99.22%). 15 individuals skipped this question.
Ethnicity
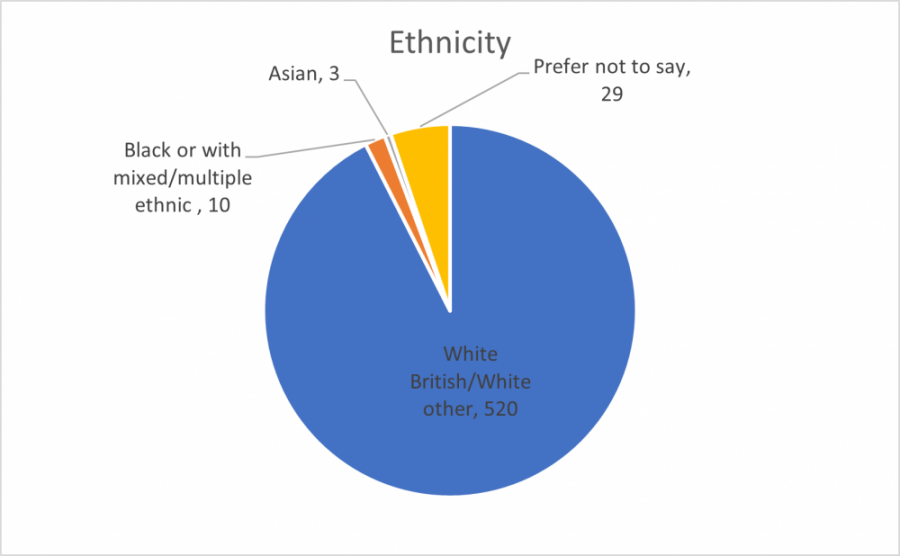
Nine out of ten respondents (520) identified as White British or White (other). 29 respondents (4.48%) preferred not to answer, three identified as Asian and ten identified as Black or with a mixed/multiple ethnic background. Seven respondents skipped this question. These results are in line with 2018 and 2016 member survey figures.
Age
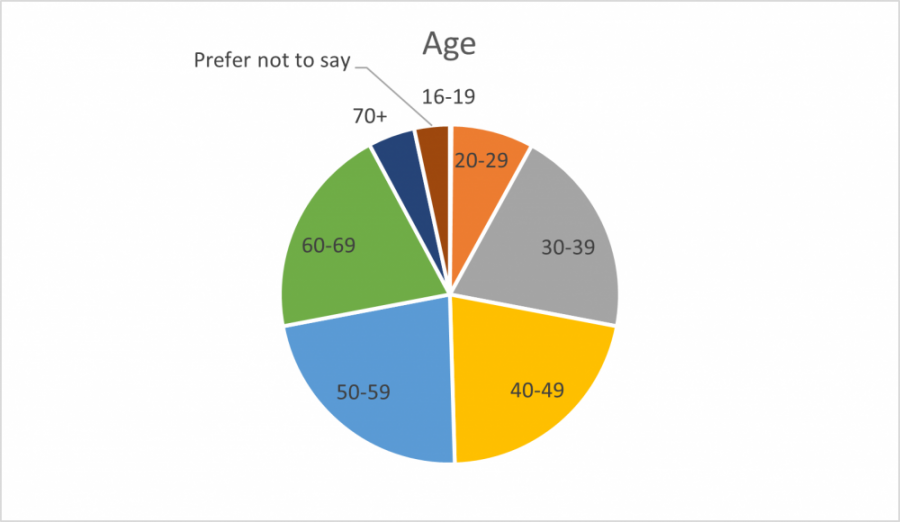
The modal age range of respondents is 50-59 (22.46%) and 68% are 40 years old or above. 22 respondents preferred not to say and one respondent was between 16-19 years old. Five skipped this question. This is in line with the 2018 figures.
Disability
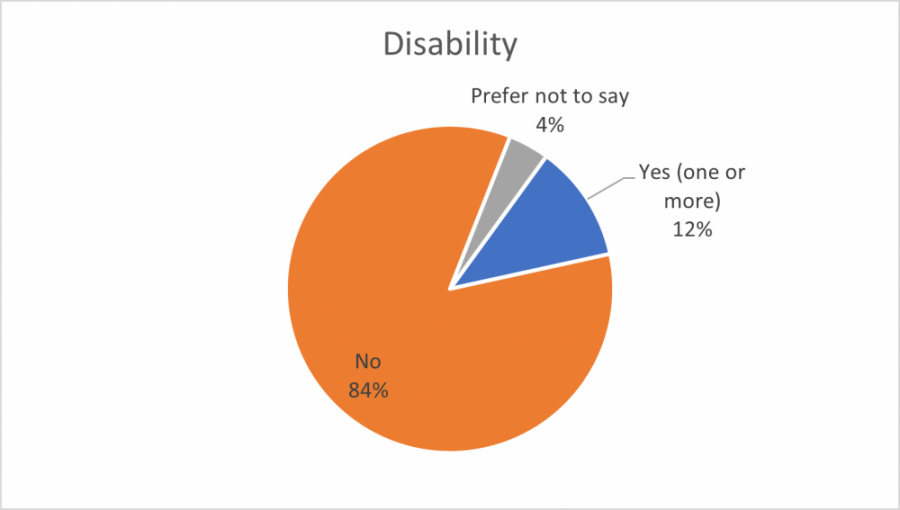
84% (547) of respondents did not consider themselves to have a disability, however 12% responded that they had one or more disabilities. When asked to provide more details, having a specific learning disability (eg dyslexia, dysgraphia, dyscalculia) featured strongly (26%), as well as the option to give another disability that was not on the prompt list (28.22%). This is a large increase to the 2018 response, where 6% of respondents considered themselves to have a disability.
Within the other disability options, 12 out of 35 responses gave multiple answers, including but not limited to, hearing impairment (7.25%), mental/emotional health (8.87%), ASD, chronic illnesses and asthma. Other answers included “prefer not to detail” (15%). Neurodiverse conditions remain the leading reported disability in this survey’s responses and there is an increase in reported mental health illnesses.
Type of work and organisation
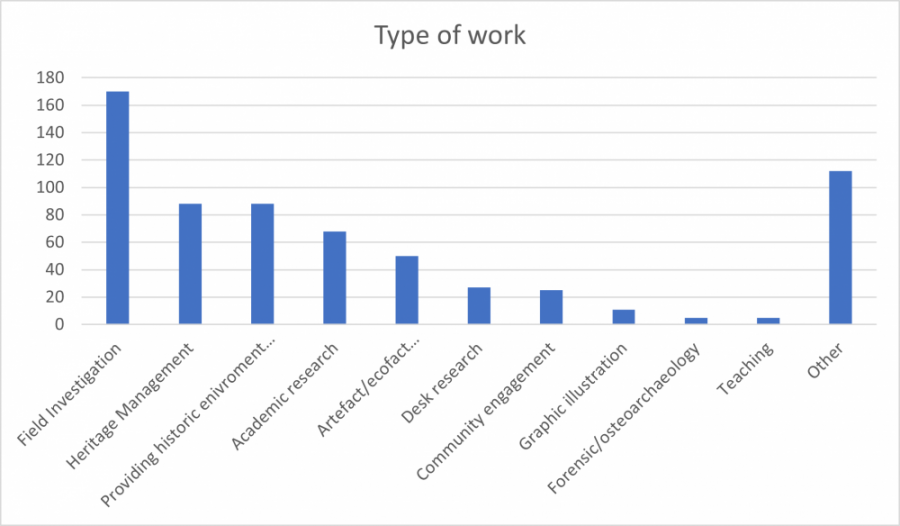
We also asked individuals about their work, with respondents being able to choose one category option, or add an 'other' option. Field investigation was the most popular from the list, at just under a third of respondents (26%). Within the ‘Other’ option (17.26%), respondents replied that they felt their work was a strong combination of many of these options and that none of them were particularly dominant.
There were also several respondents who said their work was in consultancy (23.21%), as a project manager (8.92%), or that they were retired or partially retired (6.25%), in geomatics and geophysics (4.46%), administration (4.46%), post excavation analysis or studying or in an executive/management of an organisation position (all 3.57%).
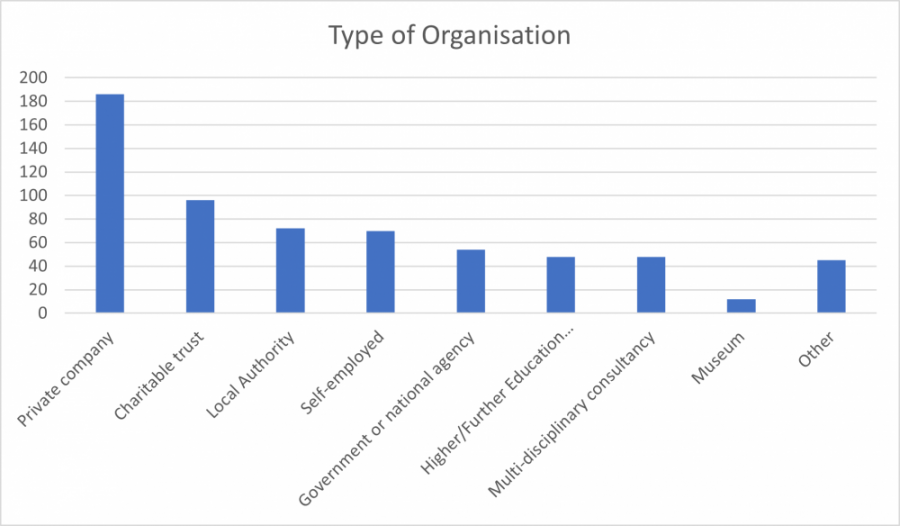
We asked respondents about the type of organisation they work for. The most popular response was working for a private organisation. Within the ‘Other’ option, responders detailed that they were involved in a multitude of organisations (17.77%). Other types of organisation given included learned societies, heritage charities and archaeological trusts.
All respondents were also asked if they work for a Registered Organisation with CIfA. Less than half of respondents work for a Registered Organisation (42%) and 3% of respondents were unsure.
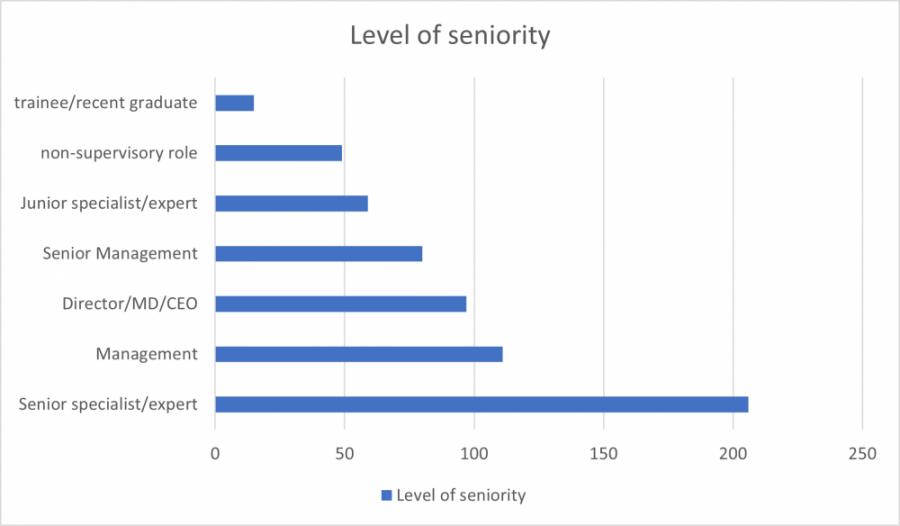
The majority of respondents had some level of seniority in their role at work. The least popular category was trainee and recent graduate (2.43%). These responses are very similar to those of the 2018 survey.
Salaries and workplace benefits
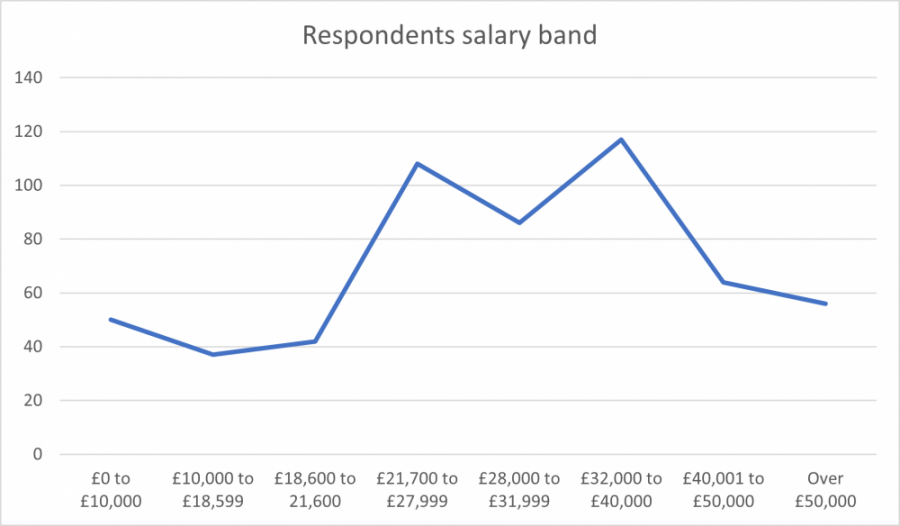
Part of our demographics data asks about salary, with band options and answers in British pounds. 69 preferred not to disclose their current salary band. The modal salary range is £32,000 to £40,000 (18.67%) with another peak earlier in the range of £21,700 to £27,999 (17.17%). This is roughly in line with the 2018 responses.
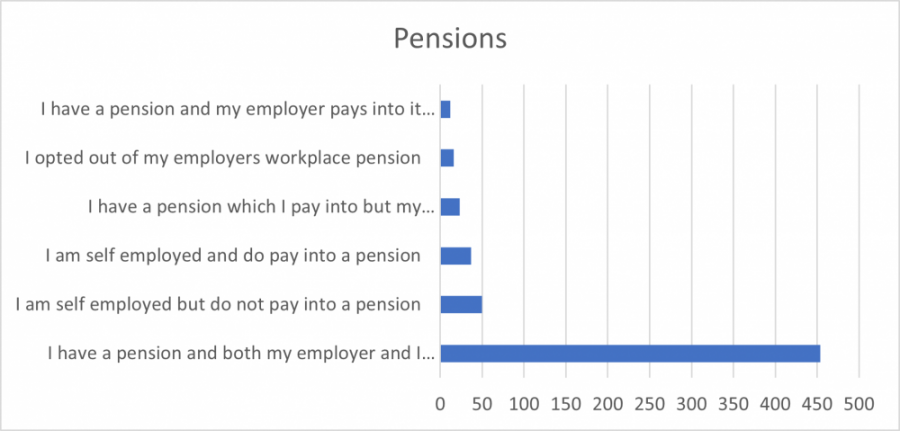
We asked respondents if they have a pension, and if so who pays into it. 63 skipped this question. Most respondents (88.56%) have a pension in place and 80.58% respondents said that their employer contributes to it. This is similar to the 2018 results.
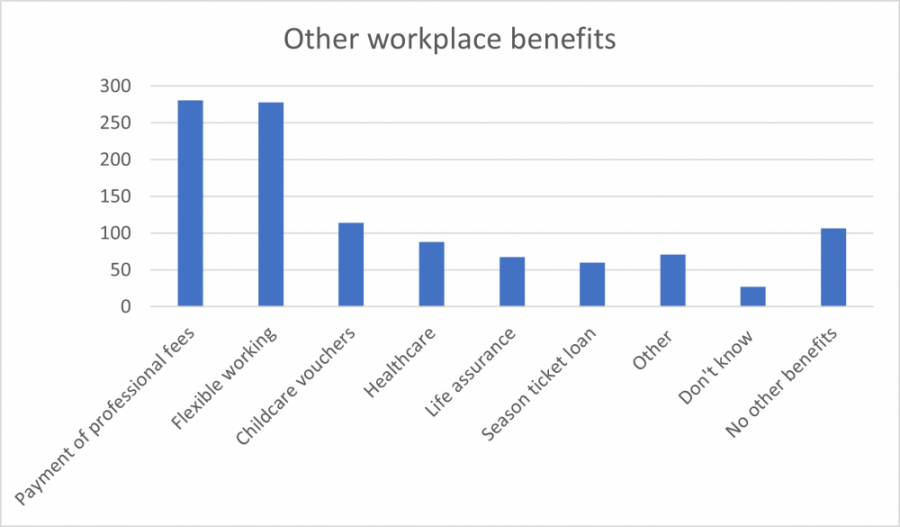
We also asked respondents what, if any, benefits they recieve as part of an employment workplace scheme. 120 skipped this question. The most popular of benefits recorded were the payment of professional fees (281 respondents) and flexible working (278). There is no certainty that the choice of flexible working has been brought on by the coronavirus pandemic, as the question has developed from a 'yes/no' question we asked in the 2018 survey.
Notable non-pension employee benefits in the 'Other' section include a budget for employees CPD (some including conferences and exhibitions), cycle to work scheme, company vehicle or technology such as a phone or laptop. Plus discounts on company products or other businesses or a perks or Perk Box scheme.
We hope you find the results interesting. Look out for the next survey bulletin coming soon, all about accreditation.